Key Takeaways
- Launch-day charts are a curated subset of a much broader internal eval suite, so they systematically overstate average performance by construction, not necessarily by dishonesty.
- Labs tune prompting and scaffolding for their own model far more carefully than for competitor baselines, creating a home-field advantage that inflates comparison gaps.
- The most reliable read on a new model's real capability comes from independent replication and your own workload testing, not the numbers published in the announcement itself.
Every benchmark number a lab publishes on launch day was produced by the one party in the world with the strongest incentive to make it look good, using a methodology nobody outside the building got to inspect before the number went live. That is not an accusation of fraud, it is a description of the incentive structure, and incentive structures predict behavior better than good intentions do. A launch-day score is best read as an opening bid, not a verified fact, and the gap between the two tends to close over the following weeks in a fairly consistent direction: down, sometimes sharply.
We do not say this to talk anyone out of paying attention to benchmarks. Benchmarks are genuinely useful when read correctly, they are one of the only quantitative windows into capability that the field has. The problem is timing. A number published the same hour as the model has not yet been tested by anyone with a reason to find its weaknesses, and until that happens, you are looking at a claim wearing the costume of a measurement.
The Task Selection Problem
Every serious lab runs its candidate model against a wide internal battery of evaluations, far broader than what ends up in a launch post. The chart you see on release day is a curated subset, and curation is not the same as fabrication, but it is also not a random sample. If a model performs well on twelve internal benchmarks and poorly on five, the natural business decision is to publish the twelve. That is rational behavior from a company telling its best story, not evidence of dishonesty, but it does mean the published chart systematically overstates the model's average performance across the full space of tasks people will actually throw at it, simply by construction.
This is worth sitting with for a moment, because the selection effect compounds across a whole industry doing the same thing simultaneously. If every lab publishes only its strongest results, then every launch-day comparison you see is a best-case-versus-best-case matchup, which tells you almost nothing about how the two models compare on the messy middle of tasks neither one chose to highlight. The honest comparison, the one that actually predicts your experience, usually only becomes visible once independent parties start running their own evaluations across a wider and less flattering task distribution.
There is a related limitation worth naming even for perfectly selected, honestly reported benchmarks: most of them test a narrow, clean version of a task, not the messy version you actually encounter. A coding benchmark typically hands the model a well-specified problem with a clear correct answer. Real engineering work involves ambiguous requirements, half-finished context from a long conversation, and a definition of correct that shifts as you go. A model can be genuinely excellent at the clean version of a task and only modestly better, or not better at all, at the messy version, and no benchmark chart will tell you which kind of improvement you are actually looking at. This is not a criticism of benchmarks so much as a reminder of what they were built to measure, worth remembering every time a clean score gets used to predict performance on a task that was never clean to begin with.
Home-Field Prompting
Benchmarks are not just about the model, they are about the scaffolding around the model at the moment of testing: the prompt template, whether the model gets multiple attempts and the best one is reported, whether it has access to tools like code execution, how much reasoning budget or thinking time it is allowed. A lab testing its own model will naturally have spent weeks tuning that scaffolding to get the best possible result, because that scaffolding is under its control and improving it is free performance. The competitor's model, tested as a baseline, often gets a more generic setup, sometimes an older prompting approach, because the team running the comparison has no incentive to spend equal engineering effort perfecting someone else's product.
This is sometimes called home-field advantage, and it is nearly impossible to fully eliminate even with good intentions, because knowing a model's quirks well enough to prompt it optimally takes exactly the kind of deep familiarity that only the team who built it has. It is one of the strongest reasons that a benchmark score reported by the lab that made the model, and the same benchmark score reported later by an independent evaluator using a neutral harness applied equally to every model in the comparison, can differ by a meaningful margin without anyone having done anything improper.
Nobody Has Checked Yet
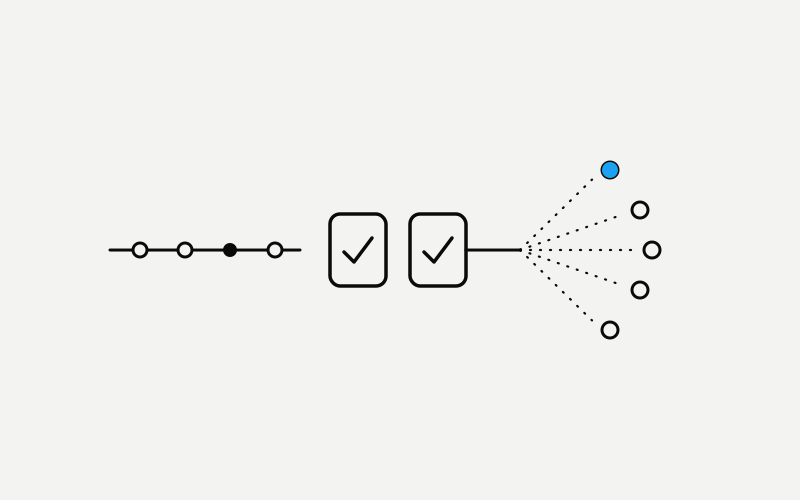
The most basic reason a day-one number deserves skepticism is the simplest one: nobody outside the lab has had time to check it yet. Independent replication is what turns a claim into a measurement, and replication takes time, compute, and access that the rest of the field only gets after launch. In the days and weeks following a release, independent researchers, third-party leaderboards, and rival labs with an interest in the outcome all start running their own versions of the same tests, sometimes with the exact prompts and setup disclosed, sometimes reverse-engineered from what the lab published. The scores that come out of that process tend to cluster around a number that is often, though not always, a little lower than what launched.
There is a deeper version of this problem too, which is contamination: as benchmarks age and their questions circulate publicly, there is a real risk that some of that material ends up inside the training data of later models, inflating scores in a way that has nothing to do with genuine capability and is very difficult for an outside observer to detect. This is one reason the field keeps needing new benchmarks, and why a model's stellar performance on a benchmark that has been public for years deserves slightly more suspicion than the same performance on something newer and less likely to have leaked into anyone's training set.
There is also a slower-moving version of this same problem across the whole field: once a benchmark becomes well known enough to show up in every release post, it starts becoming a target rather than a measurement. Teams start optimizing for the tasks a popular benchmark contains, sometimes explicitly, sometimes just because engineers naturally test against whatever the field is currently watching. A benchmark that once tracked general capability reasonably well can drift, over a year or two of an entire industry aiming at it, into something that tracks performance on that specific benchmark more than it tracks the underlying skill it was originally built to measure. This is a widely discussed dynamic in the field, not a secret, and it is one more reason a single popular benchmark score, even a verified one, deserves to be read alongside several others rather than treated as a complete picture on its own.
The Sample Size Nobody Reports
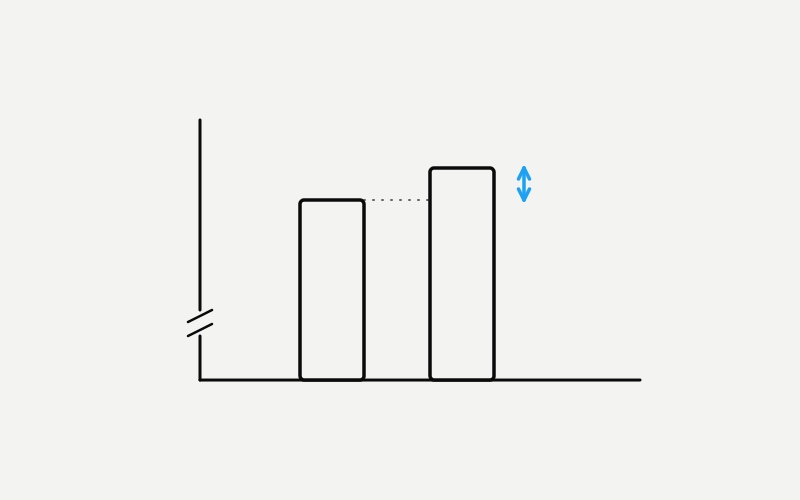
A benchmark score is often presented as a single clean percentage, but that percentage is an average over some number of test cases, run some number of times, and both of those numbers matter more than the industry's habit of headline reporting would suggest. A score built from a few hundred questions carries real statistical noise, enough that a rerun of the exact same model against the exact same benchmark can land a couple of points higher or lower purely by chance, especially on harder tasks where the model's answer is not fully deterministic. A launch chart showing a two-point lead over a competitor is making a claim that may not survive a second run of either model, and it almost never comes with the error bars that would let you judge whether the gap is real or noise. Serious independent evaluators report confidence intervals or run multiple trials for exactly this reason. Launch posts, understandably eager to report one clean number, usually do not.
This matters most at the top of a leaderboard, where the gap between first and second place is frequently smaller than the noise in the measurement itself. Treating a narrow benchmark lead as a meaningful capability difference, rather than as a statistical toss-up dressed up as a ranking, is one of the more common mistakes even sophisticated readers make. A wide, consistent gap across many independent runs is a real signal. A one or two point edge on a single reported run, on a benchmark with a few hundred questions, is closer to a coin flip that happened to land in the new model's favor on the day someone happened to publish it.
What to Actually Check Once the Dust Settles
None of this means benchmarks are useless, it means the useful reading happens on a delay. Look for whether the lab disclosed its exact methodology: the prompts used, the number of attempts, whether tools were enabled, whether the comparison models were tested under equivalent conditions. A lab willing to publish that level of detail is giving you enough information to judge the number rather than just trust it, and that transparency is itself a meaningful signal, independent of the score. Look also for variance, not just a single point estimate: a model that scores well on average but with wide swings across repeated runs is a less reliable tool than one that scores slightly lower but consistently, even though the launch chart will only ever show you the average.
Then wait, genuinely wait, for independent leaderboards and third-party evaluations to catch up, which usually takes anywhere from a few days to a few weeks depending on how much access outside researchers have. And when all of that is done, run the one benchmark that actually matters to you: your own representative task, your own data, your own definition of success, because no public benchmark, however well constructed, was designed with your specific workload in mind. Day-one numbers are not lies in the sense of being invented, they are closer to a photograph taken from the most flattering angle available. The picture is real. It is just not the whole room.